Information Design · 2026 · Self-initiated concept
Water Atlas
Ten pages on the world's freshwater, built only from published data.
- Format
- Live HTML · PDF, 10 pages
- Discipline
- Information Design
- Year
- 2026
- Tools
- 5
Overview
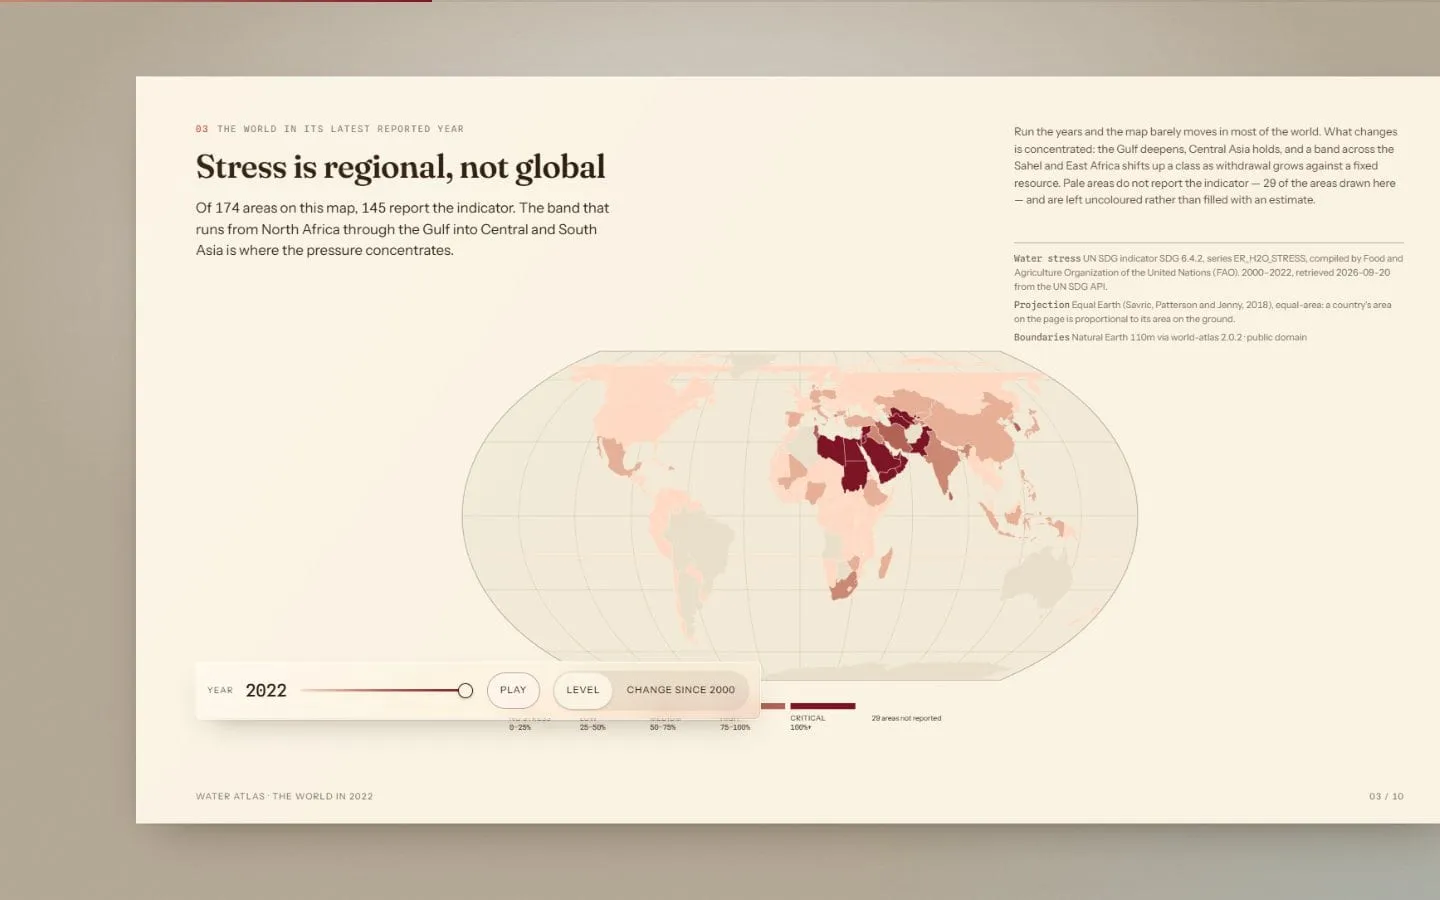
Water Atlas is ten pages on the world's freshwater: who has it, who withdraws it, and who still cannot drink safely. It makes one argument: the global average has not moved, and everything underneath it has.
Challenge
World water stress went from 17.47% in 2000 to 17.77% in 2022, which looks like nothing. The pages had to show what that average hides without estimating or inventing a single figure.
Solution
Every number comes from FAO, the World Bank or the WHO/UNICEF Joint Monitoring Programme. Nothing is interpolated, and the two figures computed for the atlas say so where they appear. It is an edition, not a scroll: each page is a composed sheet fitted to the screen.
Process
- 01
Research
Sourced every series from FAO, the World Bank and the Joint Monitoring Programme.
- 02
Argument
Built all ten pages around a single claim.
- 03
Charts and maps
Drew the charts and map geometry from the data inside one self-contained file.
- 04
Edition
Fitted every page to the viewport and produced a PDF edition.
Screenshots
Sample Material
Everything behind the project, as it was delivered.
The live build
One self-contained HTML file that runs in the browser, offline, with nothing to install.
Tools used
- HTML & CSS
- SVG
- Python
- PyMuPDF
- Puppeteer
Outcomes
- Ten pages, each fitted to the viewport so nothing spills.
- Every figure traced to FAO, the World Bank or the WHO/UNICEF JMP.
- The two computed figures labelled where they appear.
This is a self-initiated concept. The outcomes describe what was made and measured, not results for a client.